

Introduction to Data Analysis in Plant Biotechnology
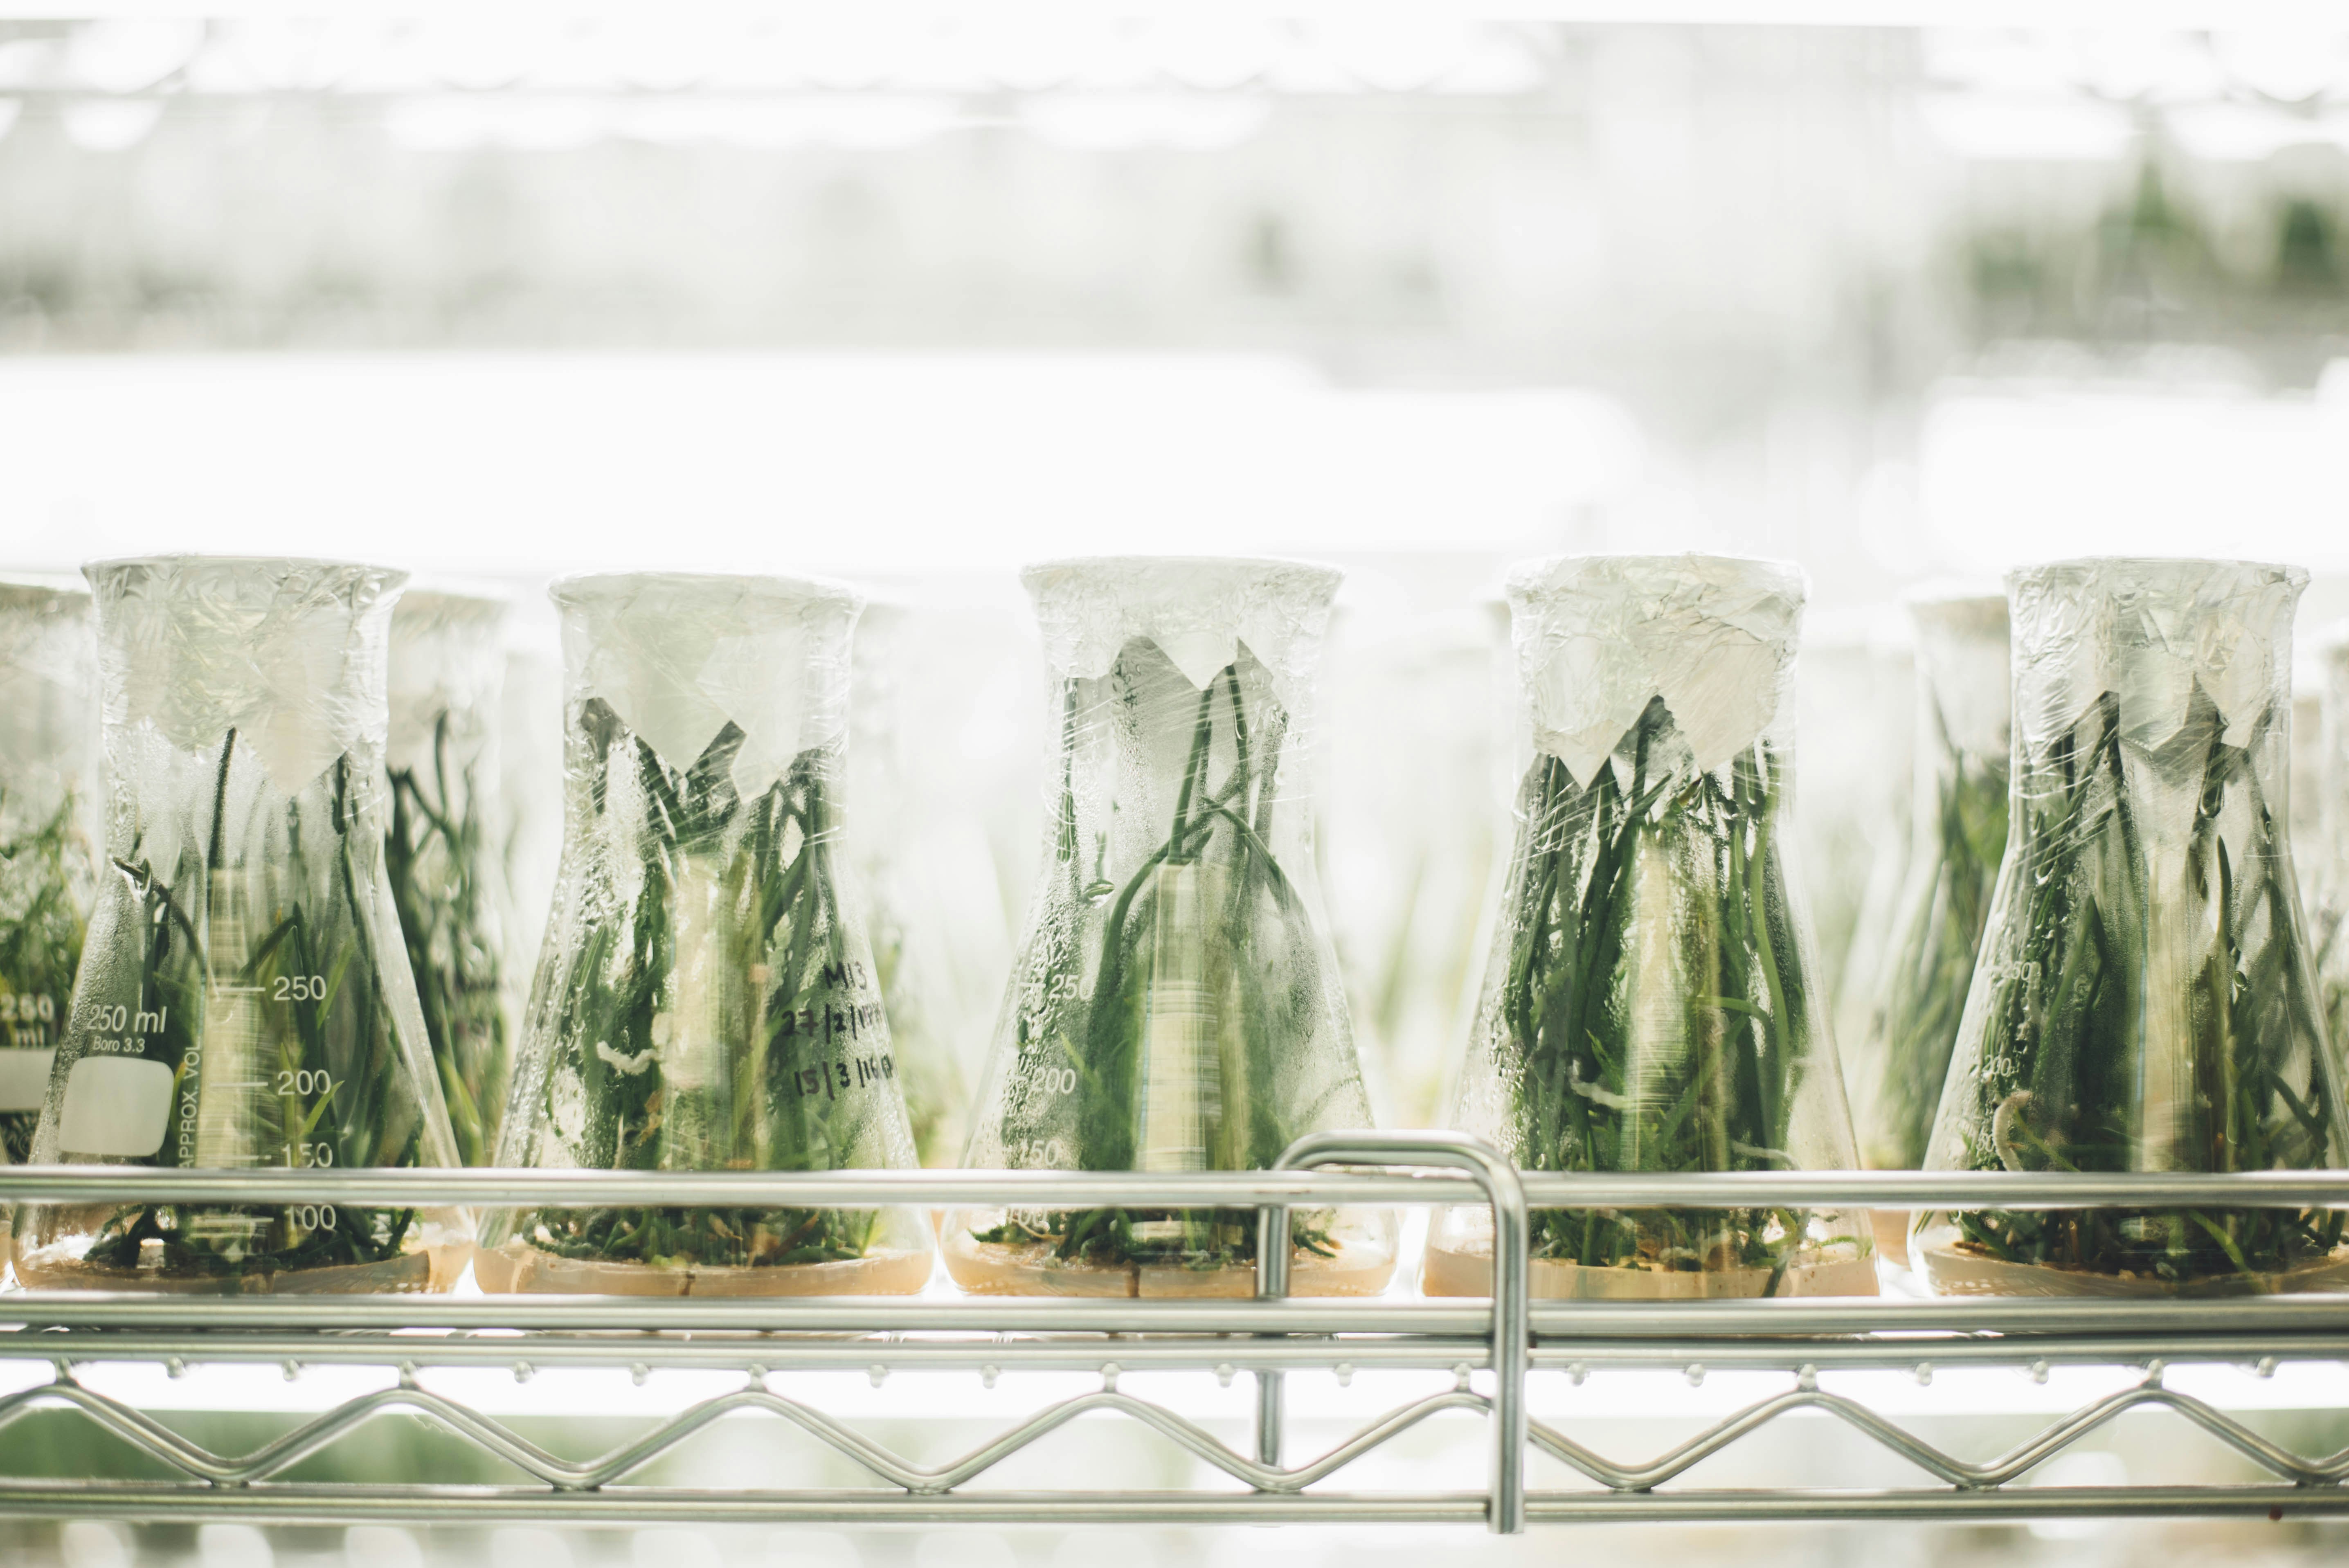
Data analysis plays a vital role in the field of plant biotechnology, serving as a cornerstone for scientific research and development. This discipline involves the meticulous examination of various biological parameters to draw meaningful conclusions that can ultimately improve plant productivity, resistance, and quality. The significance of data analysis becomes particularly apparent in postharvest studies, where the quality and shelf-life of crops are assessed after the harvesting process. Insights gained from such analyses facilitate the identification of optimal storage conditions, processing methods, and packaging techniques.
The objectives of data analysis in plant biotechnology are multifaceted. Researchers aim to uncover patterns, correlations, and trends by applying structured methodologies to their experimental data. By doing so, they can establish a foundation for further experiments and innovations in biotechnology. The significance of this analysis is underscored by the increasing complexity of biological systems, where simple visual observations are often insufficient to understand underlying mechanisms. Therefore, employing robust statistical methods allows practitioners to make informed decisions based on empirical evidence.
Among the various statistical techniques available, Analysis of Variance (ANOVA) stands out as an essential tool in the repertoire of plant biotechnologists. ANOVA enables researchers to compare multiple groups simultaneously, providing a framework for testing hypotheses related to different treatment effects on plant growth, yield, and other critical attributes. By systematically analyzing experimental data using ANOVA, scientists can derive significant conclusions, isolate variables, and assess the effects of various interventions. This ability to validate findings enhances the reliability and credibility of the research conducted in the plant biotechnology sector.
What is ANOVA?
Analysis of Variance, commonly referred to as ANOVA, is a statistical method that is extensively utilized in various fields, including plant biotechnology. ANOVA is primarily used to test the hypothesis that three or more populations have equal means, offering a way to analyze the variance within and between these populations. This approach allows researchers to discern whether observed differences in data are statistically significant or merely due to sampling variation.
There are two main types of ANOVA: one-way ANOVA and two-way ANOVA. One-way ANOVA is applicable when assessing a single factor or independent variable that influences a dependent variable. For example, researchers could employ one-way ANOVA to evaluate how different fertilizer types impact plant growth rates. In contrast, two-way ANOVA is utilized when assessing the simultaneous effects of two factors on a dependent variable. An example of two-way ANOVA in plant biotechnology might involve examining the effects of varying light conditions and nutrient levels on plant height.
ANOVA is particularly advantageous in plant biotechnology due to its ability to handle multiple groups without increasing the risk of Type I errors, which can occur when multiple t-tests are conducted. This makes ANOVA a robust choice for experiments that aim to compare the effects of various treatments or environmental conditions on plant development. Moreover, because ANOVA evaluates variance, it provides insights not only into whether differences exist but also into the magnitude and direction of those differences.
This method has become a favored tool for plant biotechnologists due to its adaptability and efficiency in handling complex experimental designs. Its capability to analyze multiple variables and interactions allows researchers to make more informed decisions about plant management strategies and the development of new biotechnological applications. By understanding and applying ANOVA, researchers can gain valuable insights that enhance the study and improvement of plant species.
The Importance of Standard Error and Standard Deviation
In the realm of plant biotechnology, the application of statistical measures such as standard deviation and standard error is paramount for understanding the reliability and variability of experimental data. Standard deviation quantifies the amount of variation or dispersion of a set of values. A low standard deviation indicates that the data points tend to be very close to the mean, while a high standard deviation signifies that the data points are spread out over a wider range of values. This measure is essential in plant biotechnology, as it helps researchers understand how much variability exists within their experimental data, guiding them in interpreting results accurately.
On the other hand, standard error is a statistical term that measures the accuracy of the sample mean by estimating the variation between sample means that one would obtain if they took multiple samples from the same population. It is calculated as the standard deviation divided by the square root of the sample size. A smaller standard error suggests that the sample mean is a more accurate representation of the population mean. This aspect is particularly critical in plant biotechnology experiments, where sample sizes may be limited, and the reliability of results is vital for drawing valid conclusions.
For instance, in a study analyzing the impact of a specific fertilizer on plant growth, researchers may find a standard deviation indicating considerable variability in growth rates among test samples. Coupling this information with a calculated standard error can help assess whether these differences are statistically significant or merely due to random variation. Such clarity enables researchers to differentiate between actual effects of treatments and natural variations in experimental conditions, thereby enhancing the overall reliability of their findings and allowing for more robust conclusions regarding plant biotechnology practices.
Step-by-Step Guide to Conducting ANOVA
Analysis of Variance (ANOVA) is a statistical method used to determine whether there are significant differences between the means of three or more independent groups. The following step-by-step guide is tailored specifically for beginners in plant biotechnology, facilitating a smooth introduction to this valuable technique.
Firstly, the essential step is selecting the right data. Ensure you have at least three different groups for comparison, where each group represents a different treatment or condition in your plant experiments. For instance, if you are testing the effect of various fertilizers on plant growth, your groups might consist of plants treated with Fertilizer A, Fertilizer B, and a control group with no fertilizer. It’s crucial to collect sufficient samples within each group to achieve reliable results.
The second step involves setting up your hypotheses. Formulate a null hypothesis (H0) stating that there are no significant differences among group means. Conversely, your alternative hypothesis (Ha) suggests that at least one group mean is different. This framework helps guide the statistical testing process.
Next, calculate the ANOVA using appropriate statistical software or tools. Inputs for this calculation typically include the means of each group, the variances, and the number of observations in each group. For beginners, utilizing software like R or SPSS can simplify this process, since they have built-in functions for performing ANOVA. The resulting F-statistic will help evaluate the null hypothesis.
After computation, interpreting the results is crucial. If the p-value obtained from the ANOVA is less than your significance level (commonly set at 0.05), you can reject the null hypothesis, signifying that there are significant differences among the means of your groups. Supplementing these results with post-hoc tests, like Tukey’s HSD, can further clarify which specific groups differ.
Through this structured approach, beginners can successfully conduct ANOVA in their research within plant biotechnology—facilitating deeper insights into the effects of experimental treatments.
Creating Postharvest Graphs for Data Visualization
Data visualization plays a pivotal role in communicating the outcomes of research, particularly in postharvest analysis within plant biotechnology. Accurate representation of data is essential for interpreting the effects of different treatments and conditions on plant materials, which is where graphical tools become invaluable. Among the various forms of visualization, bar graphs and box plots are particularly effective in illustrating ANOVA results. These tools allow researchers to convey differences among groups clearly and succinctly.
Bar graphs are widely utilized in presenting aggregated data, making it easy to visualize mean values or specific metrics across various treatment groups. Each bar represents a different group, making it straightforward to assess comparative performance or treatment effects. By incorporating error bars, such as standard deviation or confidence intervals, researchers can further enhance these visualizations by providing insights into the variability of their data, thus enriching the audience’s understanding.
Box plots, on the other hand, are particularly useful for showcasing the distribution of data points within each group. They display medians, quartiles, and any potential outliers, thereby offering a comprehensive overview of the data’s spread. In postharvest analysis, box plots can highlight variations among treatment groups with respect to critical attributes such as yield and quality, helping in the identification of treatments leading to desirable outcomes.
Besides these common graph types, utilizing additional visual aids such as scatter plots or heat maps can further contribute to the clarity of findings. As plant biotechnology continues to evolve, effective data visualization remains a fundamental aspect of disseminating research findings. By adopting these graphical methods, researchers can ensure that their results from ANOVA analyses are communicated effectively to both scientific and non-scientific audiences.
Interpretation of ANOVA Results: What Do They Mean?
Analyzing data in plant biotechnology using ANOVA (Analysis of Variance) involves understanding various statistical metrics, primarily p-values and F-statistics. These values are crucial in determining the significance of the differences observed between groups in your study. The p-value helps establish whether any observed differences can be attributed to random chance or if they are statistically significant. Typically, a p-value less than 0.05 indicates that the null hypothesis—representing no difference between the groups—can be rejected, suggesting that at least one group differs significantly from the others.
F-statistics, on the other hand, compare the variance between the groups to the variance within the groups. A higher F-statistic suggests that the variation among group means is more substantial than would be expected by random sampling variability alone. If the F-statistic is large and corresponds with a low p-value, researchers can confidently assert that variations observed in plant performances or characteristics are not due to chance, hence leading towards valuable conclusions.
Practically, correctly interpreting these metrics is vital in plant biotechnology applications. For instance, if a particular genetic modification results in significantly higher yields compared to a control group, ANOVA provides the statistical backing needed to support this finding. However, common misunderstandings arise, such as misinterpreting p-values as measures of effect size or overemphasizing p-values without considering the context or biological significance of the results. It is essential for practitioners to understand that while a low p-value indicates statistical significance, it does not inherently reflect the degree of practical importance or applicability in a real-world setting.
Thus, careful interpretation of ANOVA results equips researchers in plant biotechnology with the insights needed to make informed decisions based on empirical data while avoiding pitfalls associated with statistical misinterpretations.
Presenting Data in Tables: Best Practices
Effective data presentation is critical in research, particularly when summarizing statistical analyses such as ANOVA in plant biotechnology. Well-structured tables can enhance the clarity of findings, guiding readers through complex datasets with ease. To present ANOVA results effectively, it is essential to follow specific best practices.
Firstly, tables should include key components such as means, standard errors, sample sizes, and p-values. The mean provides a central tendency, standard errors indicate the variability, while sample sizes offer context regarding data reliability. Additionally, p-values are crucial for interpreting the statistical significance of results. Organizing these elements ensures that the reader can quickly grasp essential data points without sifting through extraneous information.
Secondly, clarity is paramount. Use concise, descriptive headings for each table that accurately reflect the content. Avoid ambiguous titles; instead, be specific about what the table represents. For instance, a title like “ANOVA Results for Plant Growth Across Varieties” immediately informs the reader of the table’s focus. Also, consider the use of consistent formatting throughout your tables – this includes using the same number of decimal places, font sizes, and styles – to foster a professional appearance.
Thirdly, when displaying comparative results, consider using footnotes or annotations for further explanation of atypical data points or specific terms. This approach prevents overcrowding in the table itself and maintains clarity. Furthermore, employing horizontal and vertical lines judiciously can enhance readability and guide the reader’s eye, but avoid excessive gridlines as they can lead to visual clutter.
Lastly, including example tables from previous research studies serves as an excellent reference point. By showcasing well-organized ANOVA results from relevant literature, readers can visualize optimal table formatting while drawing comparisons to their datasets. In conclusion, adhering to these best practices will significantly improve the presentation of ANOVA results in plant biotechnology, facilitating greater comprehension of complex research findings.
Common Mistakes in ANOVA and How to Avoid Them
Analysis of Variance (ANOVA) is a powerful statistical tool frequently utilized in plant biotechnology to assess the differences among group means. However, beginners often encounter several common pitfalls that can lead to misinterpretations of their results. Understanding these mistakes is crucial for ensuring valid conclusions from ANOVA analyses.
One frequent error is the violation of ANOVA assumptions. ANOVA necessitates that the data meet certain conditions, including independence of observations, normality of residuals, and equal variance among groups (homogeneity of variance). Failing to verify these assumptions can result in inaccurate test outcomes. To avoid this, researchers should conduct preliminary tests, such as the Shapiro-Wilk test for normality and Levene’s test for homogeneity of variance. By addressing these assumptions prior to conducting ANOVA, researchers can significantly improve the integrity of their analyses.
Another common mistake is misinterpreting the ANOVA results. Beginners may mistakenly infer which specific groups are significantly different from each other based solely on the overall ANOVA F-test. While the F-test indicates whether at least one group mean differs, it does not specify where the differences lie. To accurately identify these disparities, post-hoc tests (such as Tukey’s HSD or Bonferroni correction) should be conducted following a significant ANOVA result. These tests provide clarity on which specific group means are significantly different.
Furthermore, a misapplication of the effect size is often overlooked. Researchers should not only report p-values but also provide effect size measures to convey the magnitude of differences among groups. This approach enhances the interpretability and practical significance of the findings, providing a more comprehensive view of the results.
By being aware of these common pitfalls in using ANOVA, beginners in plant biotechnology can adopt best practices that will lead to more reliable and meaningful data analysis outcomes. Ensuring adherence to assumptions, properly interpreting results, and reporting effect sizes are essential strategies for successful ANOVA applications.
Conclusion and Further Resources
In this guide, we have explored the essential aspects of ANOVA (Analysis of Variance) within the realm of plant biotechnology. Understanding ANOVA is crucial for researchers and practitioners who seek to decipher the variability within their data when assessing different factors affecting plant growth, yield, and genetic traits. By recognizing the fundamental principles of ANOVA, its assumptions, and the interpretation of results, individuals can enhance the reliability of their experimental outcomes.
Throughout this post, readers have learned about the types of ANOVA, including one-way ANOVA, which is beneficial for comparing means across multiple groups, and two-way ANOVA, which allows for the assessment of the effects of two independent variables. It is evident that these statistical tools can significantly contribute to better decision-making in plant biotechnology research. Utilizing ANOVA effectively aids in drawing valid conclusions from experimental data, thus fostering innovation in plant breeding and crop improvement.
As you apply your newfound knowledge of ANOVA, we encourage you to engage with further resources to strengthen and expand your understanding. For those interested in delving deeper into statistical analysis in the context of plant biotechnology, consider exploring the following materials:
- Books: “Statistical Methods in Agriculture and Experimental Biology” by C. A. A. de Mendiburu and “Design and Analysis of Experiments” by Douglas C. Montgomery.
- Websites: The American Society of Agronomy (crop.org) offers educational resources, while the International Society for Plant Biotechnology (ispb.org) provides access to relevant research publications.
- Online Courses: Platforms such as Coursera and edX offer courses in statistical analysis tailored to agricultural science, which often include modules focusing on ANOVA and its applications.
By leveraging these resources, you can deepen your understanding of data analysis techniques in plant biotechnology, ultimately leading to more robust experimental designs and insightful research findings.
