

Introduction to RGB
The RGB color model, which stands for Red, Green, and Blue, is a fundamental concept in digital imaging and design. It is widely used across various applications, including digital art, web design, and image processing. The RGB model operates on the principle of combining these three primary colors in varying intensities to create a broad spectrum of colors. Each color is represented by assigning values to red, green, and blue components, typically ranging from 0 to 255 in digital systems.
In practice, the combination of different intensities of the three colors can generate millions of hues. For instance, an RGB value of (255, 0, 0) signifies a pure red, (0, 255, 0) indicates green, and (0, 0, 255) represents blue. When these values blend equally, they produce shades of grey, and when combined to their maximum, they create white. This versatility makes the RGB model particularly essential in fields such as computer graphics, photography, and video production, where precise color representation is crucial.
This tutorial aims to elucidate the methods for retrieving RGB values using TBtools, a popular tool in bioinformatics and data visualization. Understanding how to access and manipulate RGB data is vital for users who want to ensure that their digital creations align with their intended aesthetic. Knowing how to accurately retrieve and interpret RGB values will enhance the quality of visual representations in various projects. The significance of the RGB model transcends its technical aspects, as it plays a pivotal role in how we perceive color in the digital world. Throughout this tutorial, the focus will be on equipping users with the skills necessary for effective color management and enhancement in their work.
What is TBtools?
TBtools, short for “Toolbox for Biologists,” is a comprehensive software application widely utilized in the fields of bioinformatics and data analysis. Designed to facilitate the processing and visualization of biological data, TBtools provides an extensive array of features that cater to the diverse needs of researchers and data analysts. One of its primary functionalities is the capability to visualize complex datasets, particularly those involving genomic, transcriptomic, and proteomic information. This visualization is crucial for understanding intricate biological patterns and relationships.
A notable strength of TBtools is its support for multiple data formats. Users can import and analyze various types of data, including but not limited to CSV, TXT, and Excel files. This versatility allows for seamless integration into existing workflows, making it an essential tool for bioinformatics practitioners. Furthermore, TBtools is designed with user-friendliness in mind, offering a graphical user interface that enables both novice and experienced users to navigate its functionalities without extensive training.
In the context of RGB analysis, TBtools stands out due to its ability to process and visualize data related to biological sequences. The software enables researchers to assess RNA-sequencing data and visualize expression levels through color-coded representations. This specific feature simplifies the analysis of gene expression variations across different conditions or time points, making it particularly useful for researchers undertaking comparative studies. Additionally, TBtools continues to evolve, with regular updates that enhance its functionalities, ensuring that it remains relevant to current scientific needs.
Overall, TBtools serves a broad user demographic, including bioinformaticians, molecular biologists, and data scientists, all of whom benefit from its robust capabilities in data visualization and analysis.
Setting Up TBtools for RGB Analysis
To effectively analyze RGB data using TBtools, the initial step is to download the software. TBtools is available for free from its official website, where you can find the latest version suitable for your operating system. Ensure that you download the correct version to avoid compatibility issues during the installation. Once the download is complete, proceed to install the software by following the standard installation prompts.
After installation, it is crucial to configure TBtools properly. This may involve setting up Java and relevant dependencies, as TBtools operates on a Java-based platform. Make sure that you have Java installed on your computer; if not, visit the Java website to download and install the latest version. After verification, set the environment variables for Java to ensure TBtools can access it seamlessly.
Once all dependencies are in place, launch TBtools and navigate to the settings menu. Here, you can customize various aspects of the tool to suit your specific analysis needs. It is advisable to adjust the memory allocation settings based on your system’s specifications to enhance performance while handling large RGB datasets. An optimal configuration not only improves efficiency but also mitigates the risk of crashes or slow operation during data analysis.
During the setup process, users may encounter common challenges, such as installation errors or incompatibility messages. If you experience these issues, consider checking the official documentation or user forums for troubleshooting tips. Engaging with the community can provide insights and support from experienced users. By ensuring that your TBtools is correctly set up and configured, you will be well-prepared to embark on the RGB analysis journey.
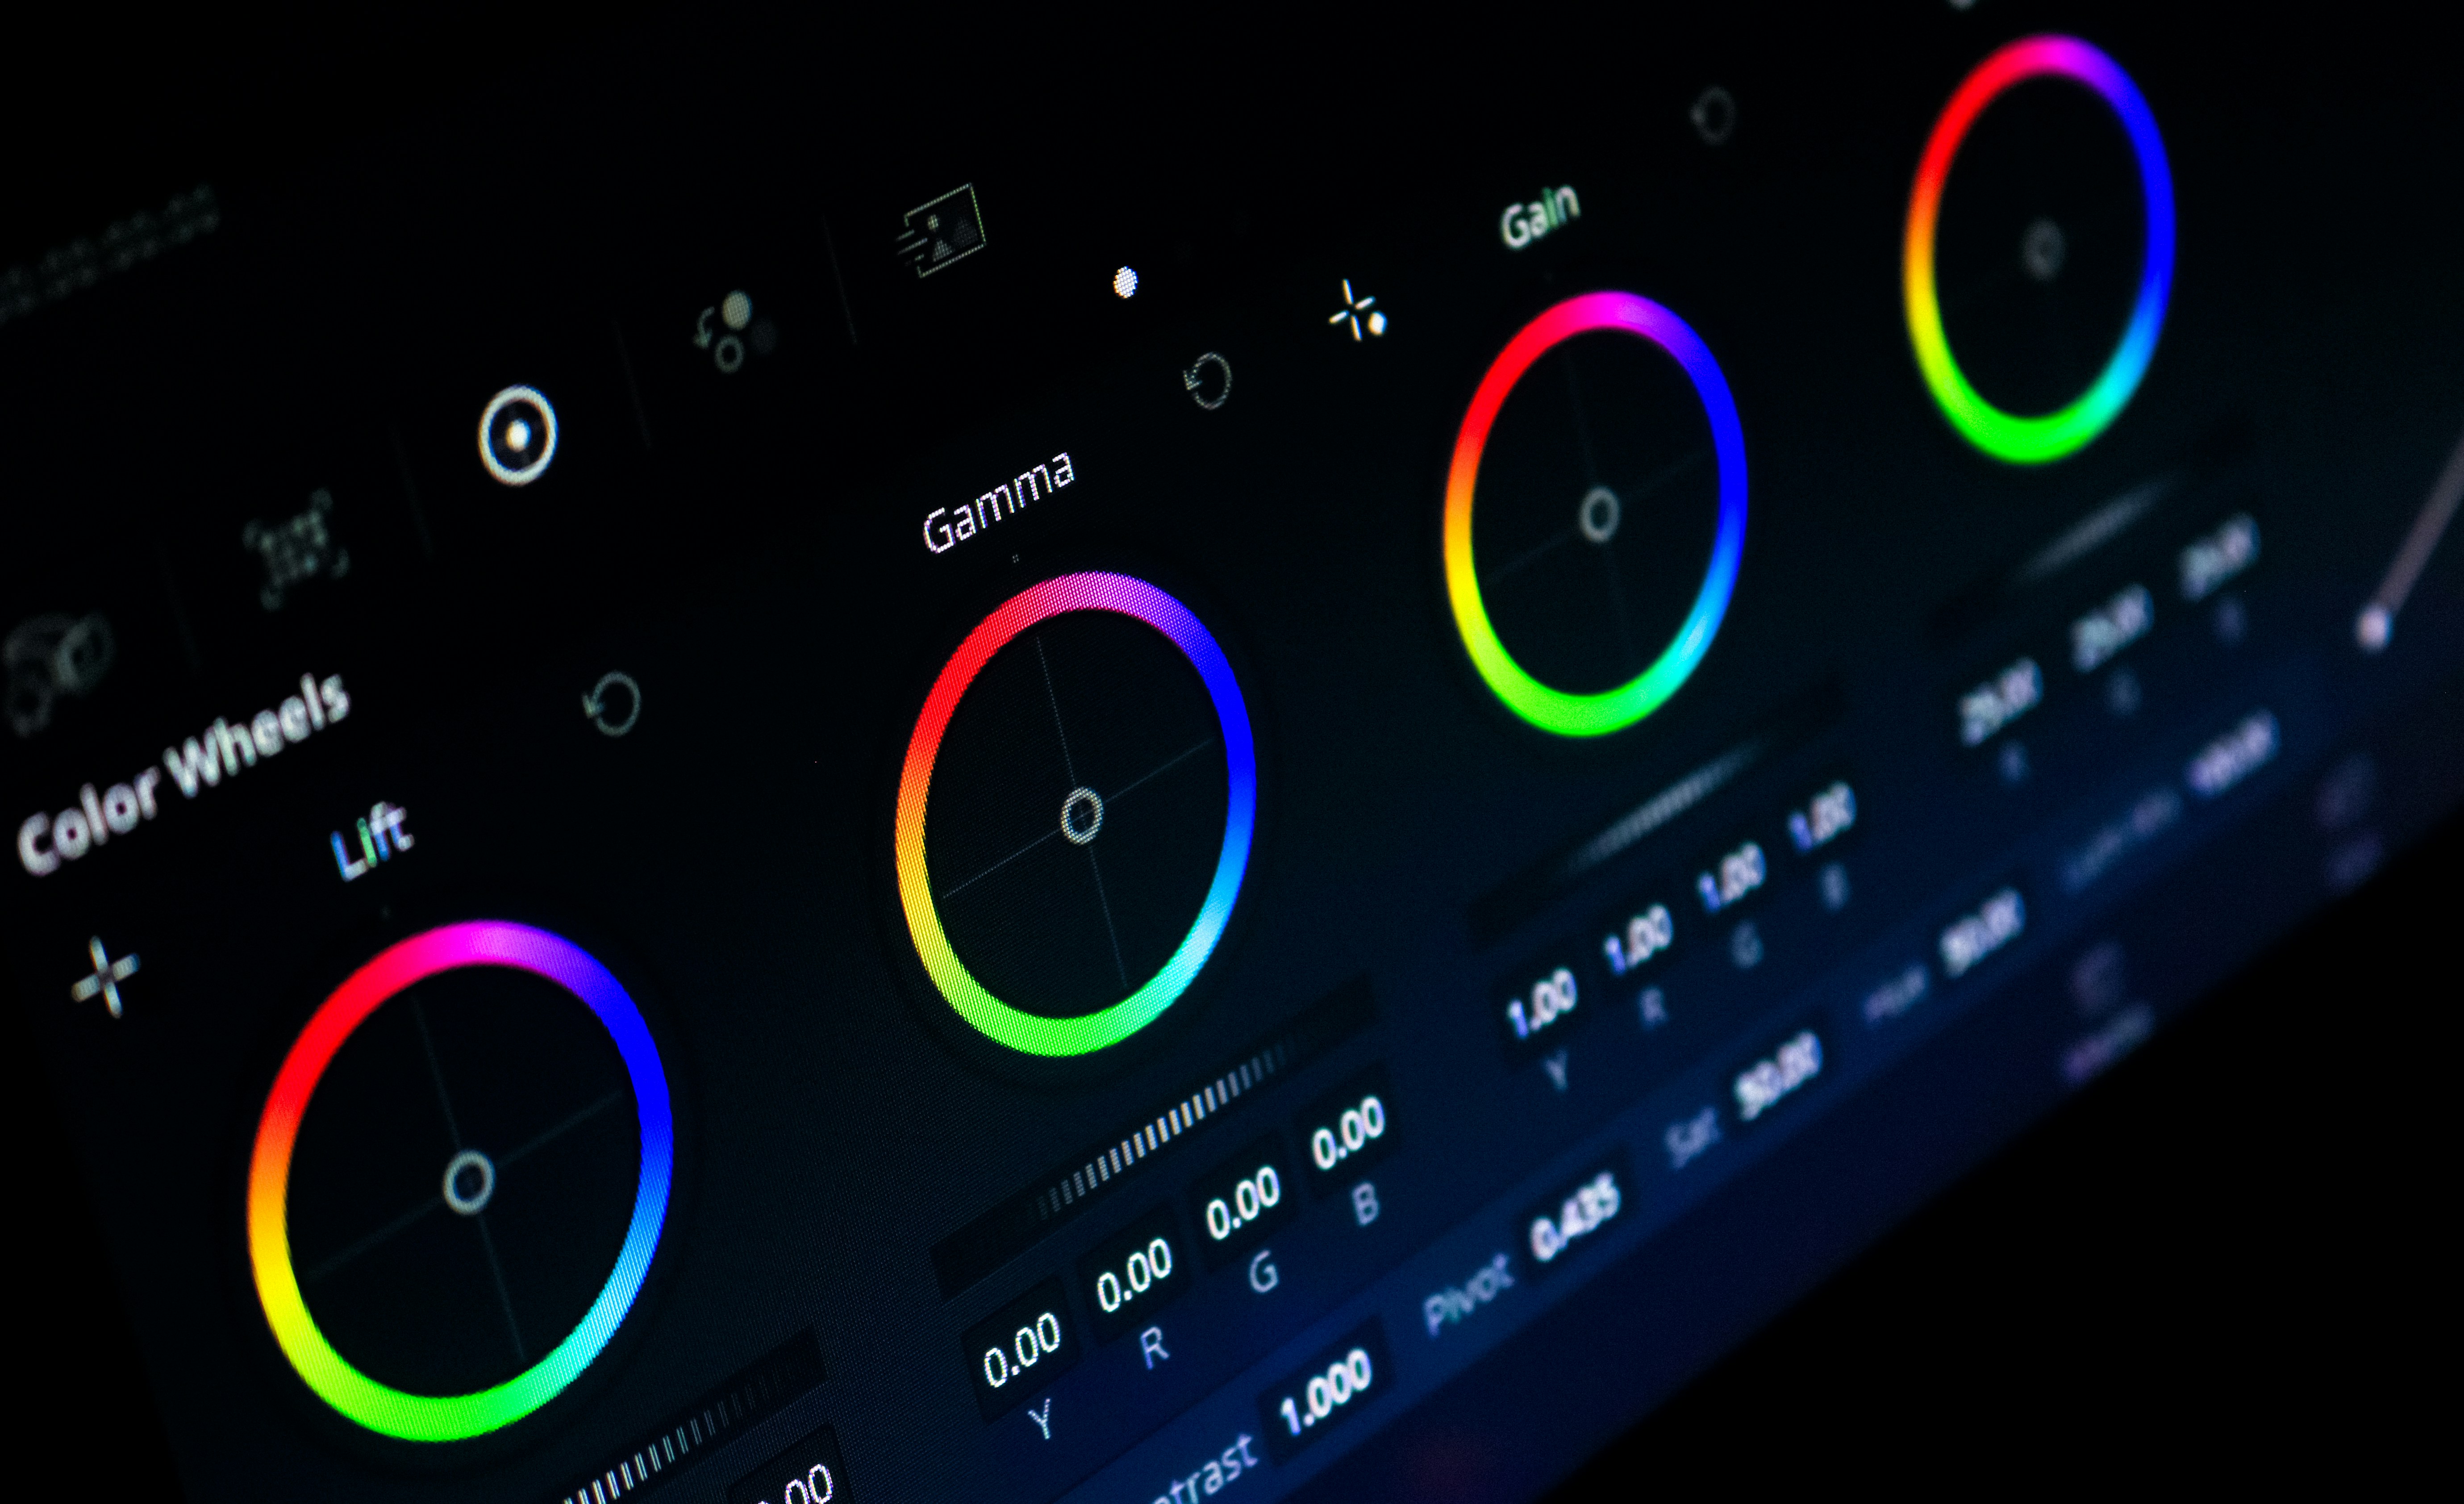
Understanding RGB Values in Data Visualization
RGB values play a pivotal role in data visualization, serving as the foundation for color representation on digital platforms. RGB, an acronym for red, green, and blue, is a color model that combines these three primary colors in various intensities to create a spectrum of colors that enhances visual outputs. In data representation, effective use of RGB can significantly improve the clarity, aesthetic appeal, and interpretability of graphical information.
In visualizations, color scales are often used to represent quantitative data. Each color in an RGB scale corresponds to a specific value or range of values, allowing viewers to quickly grasp the data being presented. For instance, lighter shades may indicate lower values, while darker hues could signify higher values. Through careful manipulation of RGB values, data professionals can convey various information densities and emotional undertones associated with the data, ultimately leading to better decision-making based on visual cues.
The selection of an appropriate color palette is crucial in creating effective visualizations. A well-chosen palette not only aids in the aesthetic quality of the data but also enhances readability, ensuring that audience members can comprehend the information without misconstruing it. Contemplating the audience’s accessibility needs is paramount, especially considering color blindness, which affects a significant portion of the population. To mitigate potential misinterpretation, it is beneficial to incorporate color schemes that distinctively contrast the RGB combinations, ensuring that critical data remains accessible to all viewers.
In utilizing RGB values within data visualization, practitioners must balance artistry and functionality. By understanding how different RGB combinations yield unique colors, they can craft visual representations that are not only appealing but also contribute to effective data storytelling strategies.
Steps to Retrieve RGB Information Using TBtools
Retrieving RGB information using TBtools involves a systematic approach that consists of several crucial steps. Initiating this process requires the user to first install TBtools, if it is not already available. Upon successful installation, the user should launch the application to begin working with their dataset.
The next step entails loading the relevant data files into TBtools. This can be accomplished by navigating to the file menu, selecting the dataset that contains the RGB values, and verifying that the data format is compatible with TBtools. Typically, formats such as CSV or TXT are supported, allowing for the seamless integration of data.
After loading the data, the user will need to access the specific functions designed for RGB extraction. This is done by selecting the ‘Data Analysis’ tab within the software. From there, the user may locate the ‘RGB Extraction Tool’, ensuring that they have highlighted the desired dataset to operate on. It is essential to configure the parameters at this stage to ensure that the output RGB values are accurate since the settings can affect the results retrieved.
As users delve deeper, they should consider adjusting parameters such as color space, scale factors, and data normalization, which can refine the RGB output further. The software provides options for visualizing the RGB outputs as graphs or charts, enhancing interpretability. Throughout this process, it may be beneficial for users to refer to visual aids, such as screenshots or diagrams, which illustrate the exact navigation path and tool utilization within TBtools.
Finally, after configuring the necessary settings and parameters, users can initiate the extraction by clicking on the execute button. The output will present the RGB values, which can then be analyzed or exported for further use, encapsulating the process of obtaining RGB information proficiently.
Practical Example: Analyzing RGB Values
The analysis of RGB values can play a significant role in various scientific research and data-driven projects, particularly in fields such as environmental monitoring, agriculture, and remote sensing. To illustrate the practical application of retrieving RGB information using TBtools, we can consider a specific case study involving satellite imagery of a local agricultural area. This example will demonstrate how to extract and analyze RGB data to derive meaningful insights regarding crop health and land use.
In our case study, we begin by acquiring satellite images of the selected agricultural area. These images typically contain three main channels representing the red, green, and blue wavelengths. Using TBtools, we can load the satellite imagery and easily access the RGB values corresponding to various pixels within the image. By selecting specific regions of interest, such as different crop types, we can extract their corresponding RGB values for further analysis.
To interpret these RGB values, we can apply a well-known index called the normalized difference vegetation index (NDVI), which uses the red and near-infrared bands to assess vegetation health. By combining the RGB data with additional data layers, researchers can identify trends such as crop vigor, potential disease outbreaks, or areas requiring irrigation. For instance, a comparison of RGB values across growing seasons can reveal how vegetation indices change over time, indicating the impact of varying weather conditions or agricultural practices.
Furthermore, the analysis can extend to machine learning applications where RGB features can be integrated into classification algorithms to automate the identification of specific land use categories. This not only enhances the efficiency of data processing but also provides robust tools for predictive analysis in agriculture. Overall, by applying the knowledge acquired through this tutorial to real-world datasets, users can gain critical insights from RGB data, facilitating informed decision-making in various domains.
Common Pitfalls and How to Avoid Them
Retrieving RGB information using TBtools can be an intricate process, especially for those who are new to data analysis. Understanding the common pitfalls associated with this software can significantly enhance the accuracy and efficiency of your work. One prevalent mistake users encounter is the improper calibration of the RGB color model. Users often overlook the importance of calibrating RGB settings before initiating data retrieval. Failing to perform this vital step can lead to discrepancies in color interpretation and inaccuracies in the results.
Another common issue arises from the selection of input file formats. TBtools supports various file types, but using incompatible formats can result in errors during the input stage. It is essential to review the documentation provided by TBtools to ensure that the file formats are supported. Utilizing incorrect data types not only impedes the retrieval process but also complicates subsequent analyses.
Moreover, users may experience confusion when dealing with the multitude of options and parameters available within TBtools. This abundance of choices can lead to an oversight of essential settings necessary for effective RGB analysis. To avoid this, it is advisable to familiarize oneself with the features and functionalities of the software through tutorials or practice sessions. Taking the time to explore these aspects can prevent misleading results and enhance overall user experience.
Lastly, insufficient understanding of the underlying concepts of RGB color models can negatively impact outcomes. Users may misinterpret how RGB values correlate with their data. To address this, it is crucial to gain a foundational understanding of color theory and data representation within TBtools. Enhanced knowledge in these domains allows for better troubleshooting and improved accuracy in data retrieval.
By being aware of these common pitfalls and implementing the suggested prevention methods, users can navigate the complexities of RGB data analysis with confidence and precision, thereby enhancing their overall proficiency in utilizing TBtools.
Best Practices for Using RGB in Data Analysis
When integrating RGB values in data analysis and visualization, several best practices can significantly enhance the overall effectiveness of your presentations. First and foremost, careful color selection is crucial. The choice of colors impacts how data is perceived and understood. It is advisable to use a color palette that is both aesthetically pleasing and intuitive. Tools like Adobe Color or Color Brewer can help in selecting palettes that are harmonious while also being functionally suited for displaying hierarchies or categories within datasets.
Maintaining color consistency across visualizations is another vital practice. Consistency ensures that viewers can easily follow and compare different elements of the analysis. Each category should be assigned a specific color that remains unchanged across different charts and graphs. This promotes a coherent narrative and prevents confusion that may arise from sudden changes in color usage. Utilizing RGB values consistently will help communicate complex information more clearly.
Furthermore, accessibility must be prioritized when working with RGB colors in data visualization. Colorblindness affects a significant portion of the population, necessitating the use of color combinations that are distinguishable to all viewers. Employing tools like Coblis (Color Blindness Simulator) can help visualize how your color choices will appear to individuals with various types of color vision deficiencies. Using patterns or textures alongside color is an effective strategy to enhance clarity and ensure all users can interpret the data appropriately.
Moreover, attention should be given to contrast. High contrast between background and foreground colors ensures readability and visual impact. Traditionally, darker colors paired with lighter backgrounds or vice versa work well. Testing various color combinations before finalizing the visualizations can result in more effective communication of key insights. The goal of these best practices is to leverage RGB information not just for aesthetic appeal but also for functionality, thereby enriching the analysis and visual representation of data.
Conclusion and Future Directions
In this tutorial, we have delved into the essential concepts surrounding RGB (Red, Green, Blue) and its pivotal role in data analysis, particularly utilizing TBtools. Throughout the discussion, we emphasized how RGB information serves as a fundamental building block for representing color data, allowing researchers and analysts to make informed decisions based on visual insights. The practical approach highlighted the various functionalities within TBtools, streamlining the retrieval and manipulation of RGB information effectively.
The significance of understanding RGB extends beyond its immediate applications. Mastery of RGB principles can enhance one’s ability to interpret complex datasets in various fields, including bioinformatics, environmental studies, and digital imaging. By leveraging TBtools for RGB data analysis, users can unlock new levels of visualization and analytical capabilities, thereby fostering more profound insights into their research.
Looking ahead, the landscape of RGB analysis and software tools continues to evolve. Future advancements may introduce more intuitive interfaces, increased automation, and the incorporation of artificial intelligence to streamline data processing and enhance analytical precision. Researchers should remain vigilant for updates and new features in TBtools and similar platforms that can facilitate more robust RGB analysis.
To further enrich your understanding of RGB and TBtools, we encourage you to explore additional resources such as online workshops, academic journals, and specialized forums. Engaging with the community can provide invaluable insights and foster collaborations that enhance one’s proficiency in RGB applications. As technology and methodologies improve, the potential for innovative applications of RGB data will undoubtedly expand, inspiring all of us to test the boundaries of our analytical capabilities.
